Expanding the Primary Electorate

A Segmentation Study on Who Participates, Who Doesn’t, and Why​

November 4, 2026

Topic

Current Events

Democracy & Elections

In 2026, just 23.3% of the voting-eligible population participated in midterm primaries. Even though turnout is higher in general elections (it was 46.2% in 2022 and 63.9% in 2024), most elections are decided during the primaries. Despite often being the most important election, especially where one party dominates the general election, many Americans are missing out on a major opportunity to choose who represents them. Primary elections also remain understudied compared to general elections, leaving questions about who participates, why, and how to help more Americans to the polls during primaries.

A new study from More in Common and Unite America Institute offers clues for how to expand this primary electorate and increase participation. Our central finding is that expanding the primary electorate is partly about helping willing but inconsistent participants become regular voters, not only making sure engaged voters turn out or persuading disengaged Americans to care. 

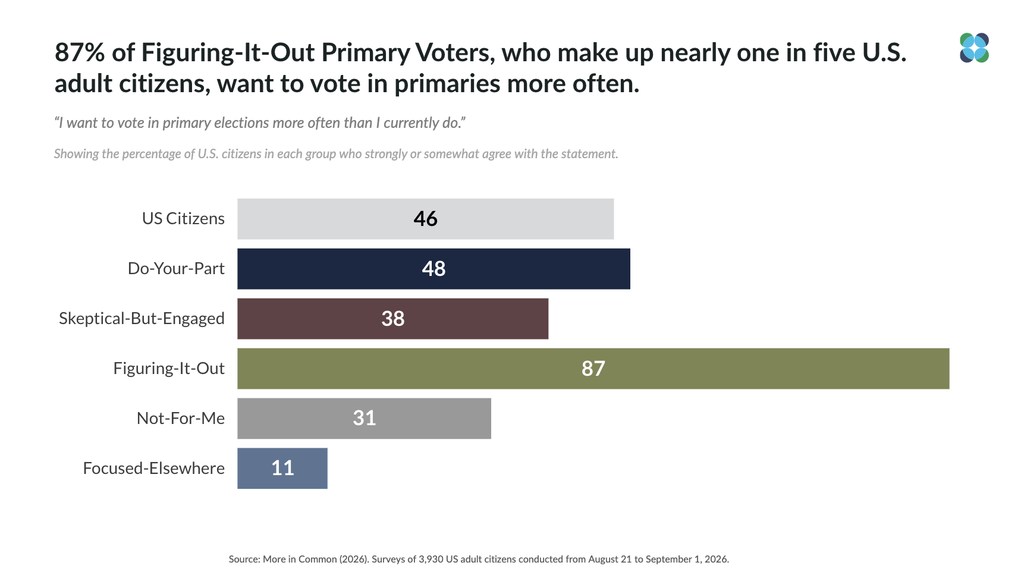
We find a sizable group of Americans (19%) who want to become more regular primary voters but are still figuring out how the process works. Among these Figuring-It-Out Primary Voters, 87% want to vote more often and 87% are interested in learning more about the basics of primary elections, including what they are for, how they work, when they take place, and how they can participate. This suggests an opportunity to turn existing interest into consistent participation through basic voter education, practical guidance, and timely reminders about upcoming primaries. 

By contrast, the two groups of highly engaged primary voters, who together make up 44% of American adult citizens, are already familiar with those basics and are more interested in learning about the candidates and issues at stake. For these voters, get-out-the-vote efforts could instead emphasize timely, nonpartisan information about candidates and what’s at stake in each primary.

The study draws on an online survey of 3,930 U.S. adult citizens, conducted from August 21-September 1, 2026, with results weighted to the adult citizen population.

Here are our key findings.  

Key Findings

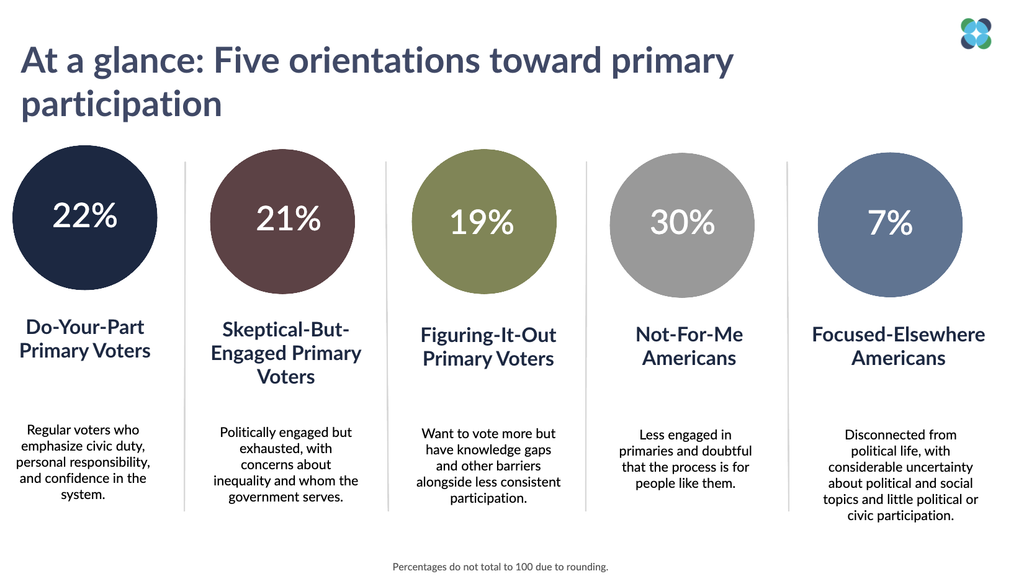
1. We identified five distinct groups of Americans based on their relationships with primary elections.

  • Do-Your-Part Primary Voters (share of adult citizens is 22%): Regular voters who emphasize civic duty, personal responsibility, and confidence in the system.
  • Skeptical-But-Engaged Primary Voters (21%): Politically engaged but exhausted, with concerns about inequality and whom the government serves.
  • Figuring-It-Out Primary Voters (19%): Want to vote more but have knowledge gaps and other barriers alongside less consistent participation.
  • Not-For-Me Americans (30%): Less engaged in primaries and doubtful that the process is for people like them.
  • Focused-Elsewhere Americans (7%): Disconnected from political life, with considerable uncertainty about political and social topics and little political or civic participation.

2. We identify a promising opportunity to expand primary participation among Figuring-It-Out Primary Voters, who make up nearly one in five U.S. adult citizens.

Their strong desire to participate coexists with less consistent voting and substantial gaps in their understanding of primary elections. 

  • Only 35% of Figuring -It-Out Primary Voters report voting in primaries every or nearly every time over the past ten years, compared with 62% of Do-Your-Part and 54% of Skeptical-But-Engaged primary voters. In 2026, 32% reported already voting in their state’s primary or definitely intending to vote if their primary had not yet occurred, compared with 44% of Do-Your-Part and 43% of Skeptical-But-Engaged Primary Voters.
  • This group’s inconsistent participation persists despite exposure to campaigns: 92% report encountering campaign information, yet half say they do not know when their state’s primary is happening.
  • This group also expresses the highest support for primary election reform. 77% support changing how primaries work, compared with 55% of Skeptical-But-Engaged voters, 54% of Do-Your-Part voters, 39% of Not-For-Me Americans, and 10% of Focused-Elsewhere Americans. Overall support is 51%.

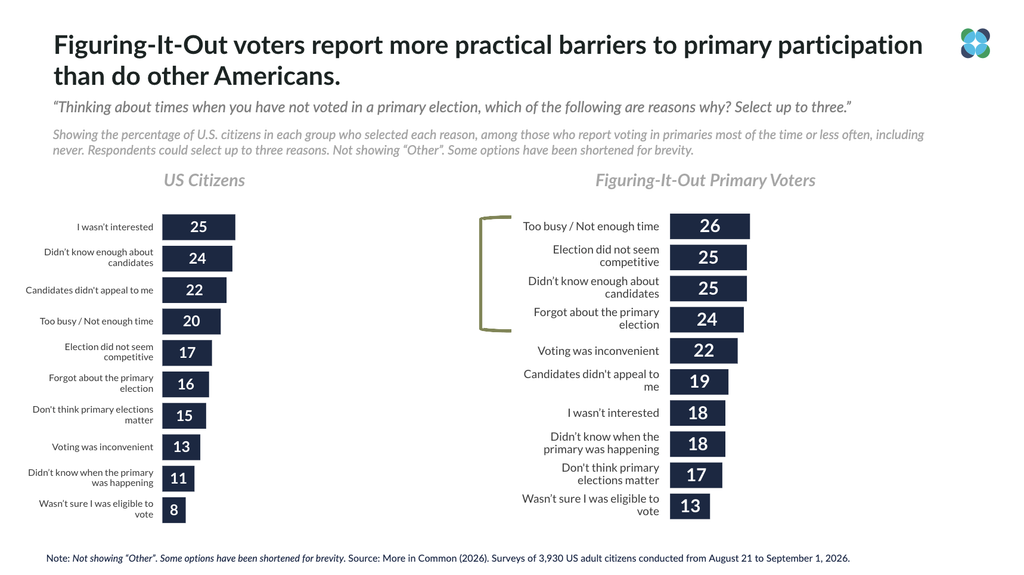
3. Figuring-It-Out Primary Voters report practical, informational, and interpersonal barriers to voting.

  • Their most frequently cited reasons for missing primary elections include lack of time (26%), insufficient candidate or issue information (25%), the outcome seeming predetermined (25%), forgetting about the primary election (24%), and voting being inconvenient (22%).
  • Registration barriers (18%) and voting causing conflict in their personal lives (17%) also stand out, particularly compared to the Do-Your-Part and Skeptical-But-Engaged groups.

4. Social context matters: primary participation is connected to family, school, and social life.

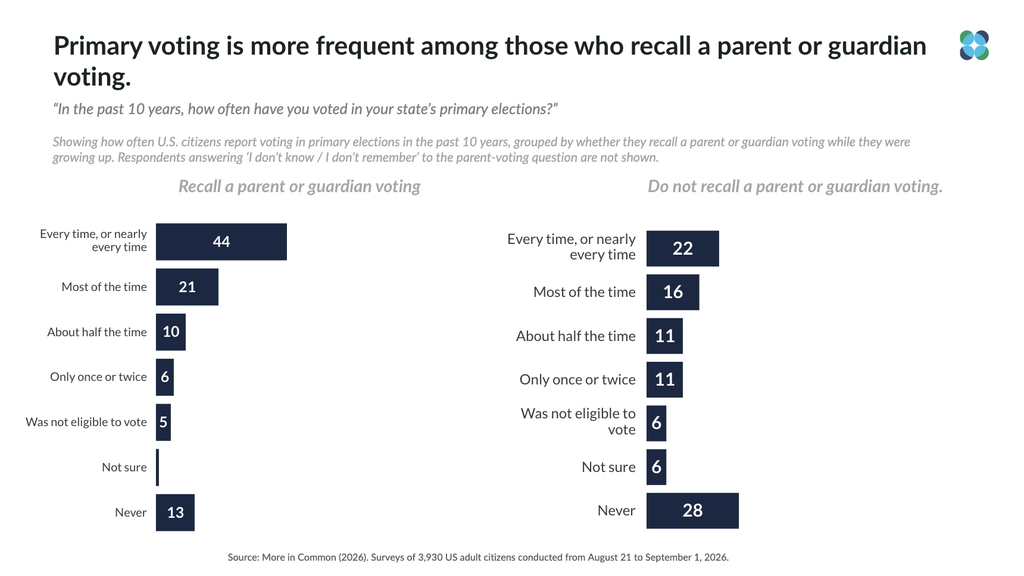
  • Respondents who recall seeing or knowing that a parent voted report 65% frequent primary voting, compared with 39% among those answering no.
  • Those who say school prepared them extremely or very well for civic participation report 73% frequent voting, compared with 39% among those who say not very or not at all well.
  • Perceived community standing shows a similar gradient: frequent primary voting is 31% among those placing themselves on the lowest end of the perceived community standing ladder, compared with 69% on the highest end.

5. Psychology also matters: personal habits and psychological outlooks are associated with primary participation and the desire to vote more.

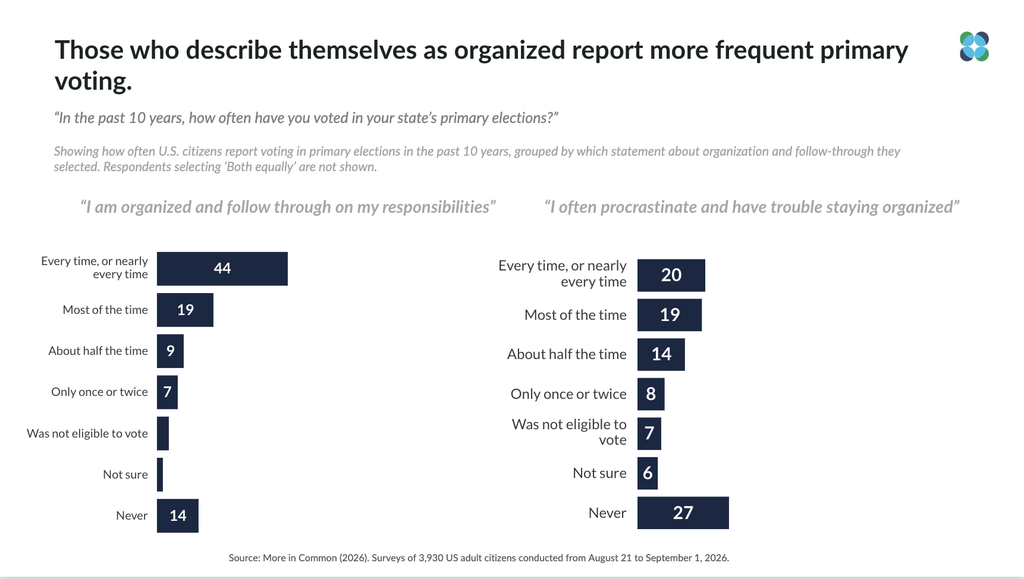
  • People who describe themselves as organized and following through report 63% frequent primary voting, compared with 38% among those describing procrastination and organizational difficulty. Yet their desire to vote more often is similar: 46% versus 49%.
  • Figuring-It-Out Primary Voters are especially likely to endorse high personal standards: 77% agree that one of their goals is to be perfect in everything they do, compared with 43% nationally. Across Americans overall, those who agree with this statement are more likely to want to vote in primaries more often (57% versus 37% among those who disagree). Perfectionism is associated with greater interest in participation, but is not established as a barrier to voting.
  • Among Americans who believe people working together can make a difference, 61% report frequent primary voting, compared with 32% among those who disagree.

6. The two most consistent primary-voter groups, Do-Your-Part and Skeptical-But-Engaged, share a commitment to civic participation but have different worldviews.

Do-Your-Part and Skeptical-But-Engaged groups together represent approximately 44% of adult citizens.

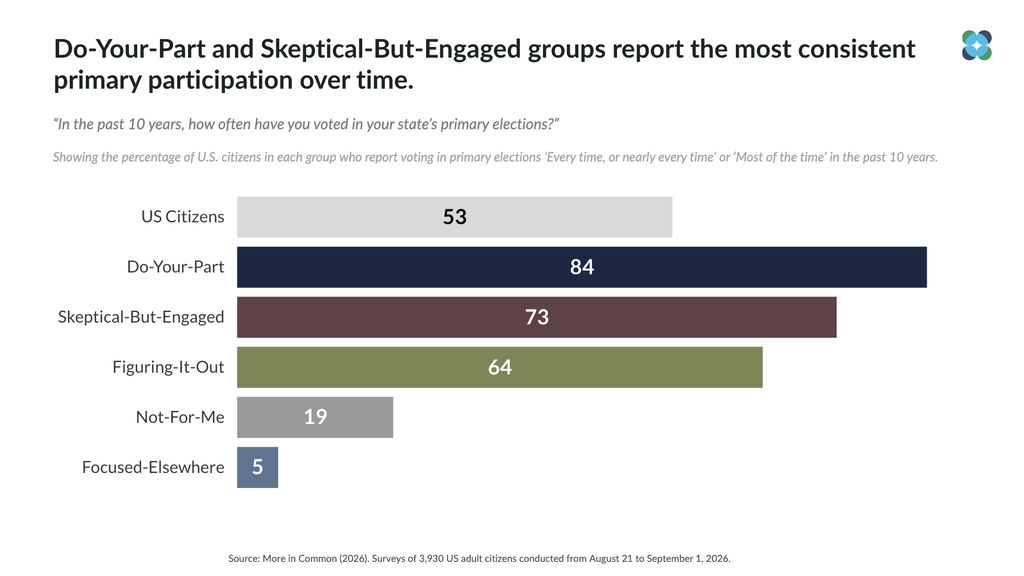
  • 84% of Do-Your-Part and 73% of Skeptical-But-Engaged voters report frequent primary voting, compared with 19% of Not-For-Me and 5% of Focused-Elsewhere Americans. 
  • The two groups have very different beliefs about individual responsibility and the fairness of the system. Do-Your-Part Primary Voters are much more likely to believe that hard work can bring success regardless of starting circumstances (84% vs. 25%). Meanwhile, Skeptical-But-Engaged Primary Voters are far more likely to believe that government is rigged to favor the wealthy and powerful (93% vs. 41%).


7. Though they together account for 37% of adult citizens, the two least-participating groups, Not-For-Me Americans and Focused-Elsewhere Americans, are not interchangeable.

Not-For-Me Americans tend to express more alienation and doubts about the relevance of primary elections, while Focused-Elsewhere Americans stand out for their uncertainty about political topics and limited connection to politics in any form. 

  • 31% of Not-For-Me Americans want to vote more often, compared with 11% of Focused-Elsewhere Americans. 
  • Voter registration also differs substantially: 66% of the Not-For-Me Americans versus 33% of the Focused-Elsewhere Americans.
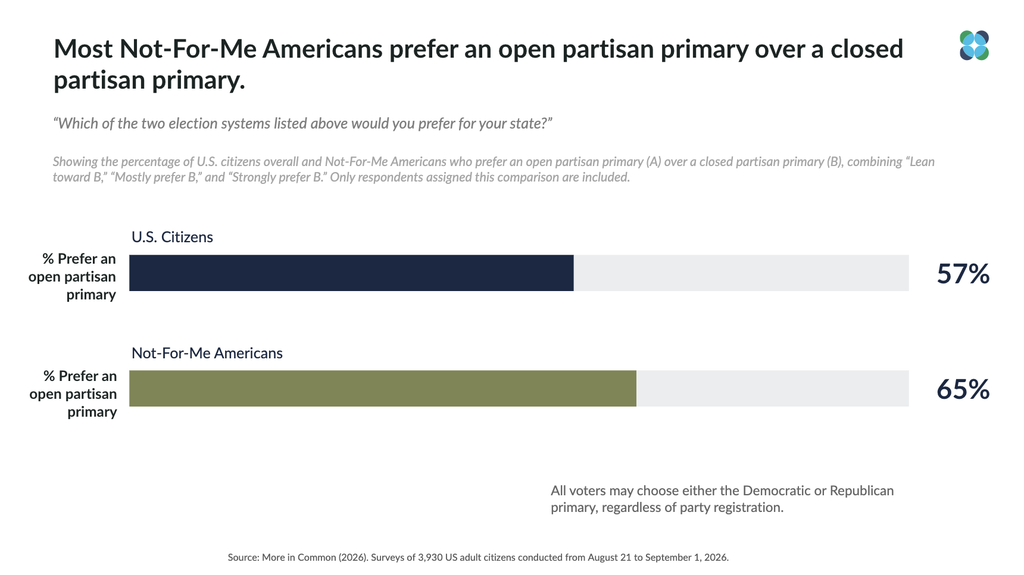
  • Not-For-Me Americans are also open to some changes in how primaries work. In a head-to-head comparison, 65% prefer an open partisan primary over a closed partisan primary. This suggests that interest in different primary systems extends beyond regular primary voters.

More in Common conducted an online survey through Dynata of 3,930 U.S. adult citizens from August 21–September 1, 2026.

At the start of fieldwork, nearly all states had held their initial statewide primaries; the exceptions were Massachusetts (September 1), New Hampshire (September 8), Rhode Island (September 9), and Delaware (September 15). Based on the primary dates recorded in the survey dataset, approximately 98% of respondents completed the survey on or after their state’s primary election day.

Results were weighted to the adult citizen population by age and gender, race/ethnicity, education, region, and 2024 presidential vote and turnout. The study reports a weighting-adjusted margin of error of ±1.82 percentage points for national estimates, with greater uncertainty for subgroups. Reported percentages are weighted. Voting measures are self-reported, not validated against official voting records. Frequent primary voting means reporting voting every or nearly every time, or most of the time, over the past 10 years. The 2026 participation figures combine respondents who reported already voting with those who said they definitely would vote and whose state’s primary had not yet occurred when they completed the survey. Observational associations do not establish causality.

Primary Orientations segmentation: We conducted exploratory factor analysis prior to the segmentation, using minimum-residual extraction and oblimin rotation, summarized 60 retained survey inputs into ten underlying factors covering primary-election orientations, political attitudes, core beliefs, psychological characteristics, social experiences, and civics education. These factors were used in k-means++ clustering to identify five segments. The solution was selected after evaluating alternative models for internal stability and relationships with key outcomes. Segment shares describe the U.S. adult citizen population, not the primary electorate.

More in Common conducted qualitative research with 304 participants through its “Americans in Conversation” panel from October 14-20, 2026, to explore participants’ experiences and interpretations in their own words and assess the segment profiles.

23.3%

of the voting-eligible population participated in midterm primaries.

19%

of Americans want to become more regular primary voters but are still figuring out how the process works.

87%

of Figuring It Out Primary Voters want to vote more often and 87% are interested in learning more about the basics of primary elections.

Related Reports

Current Events, Democracy & Elections, Narrative & Communications, Perception Gaps
09 June 2025

Shared Ideals, Divergent Realities​

American Identity
Cover titled 'The Story of Civics Among American Adults'

12 March 2024

The Story of Civics Among American Adults

Home / Publications / Expanding the Primary Electorate

Download Full Report

Explore the depth of our research at your fingertips. Get the complete insights by downloading the full report today.

Sign Up for Our Newsletter

What unites and divides Americans today? This newsletter takes a closer look at issues pressing on America’s social and political fabric and provides recommendations for how to strengthen ties to keep us bound together.